Would bullish trend start in the Bitcoin market?...Analysts show mixed responses on the future of BTC marketBitcoin, the world’s biggest digital asset, remains the level of USD 9,000 for last weeks. Even with temporal volatility that had been shown for several times, the cyrptocurrency has been traded at the level of USD 9,000 for nearly couple of weeks.
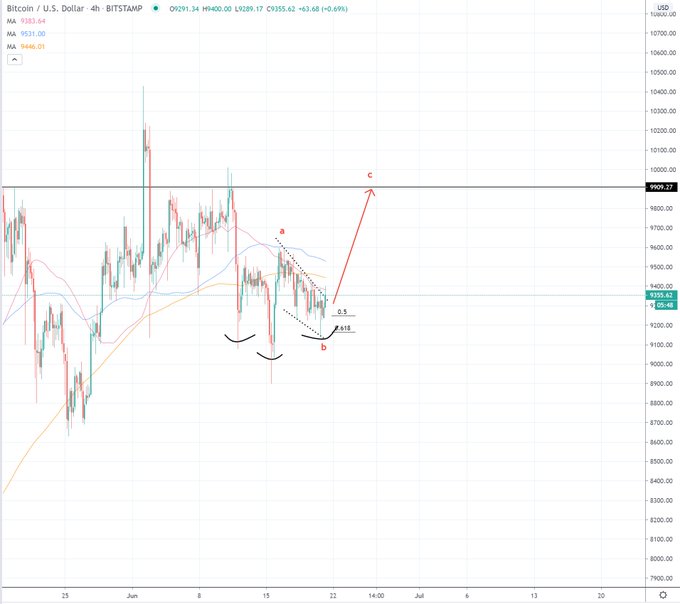
"A bull flag chart pattern of BTC means that its price would rally for several days. So, it would rally around the level of USD 9,900 after breaking the USD 9,400 resistance line," anticipated NewsBTC, an online cryptocurrency media, citing Smartcontracter, a prominent analyst on Twitter.
Smartcontractor. Pointing out technical issues of BTC, he predicted that the price would dip within several days or weeks. He noted that BTC's following area of interest would be USD 7,700-7,800.
suggest that institutions are leaning short on BTC. So, the cryptocurrency would show bearish sign for next several weeks or months," explained CryptoUnfolded, a data analysis firm, citing a report published by Chicago Mercantile Exchange(CME).
"BTC has to break the hurdle of the USD 9,500. Then, the digital currency can move towards the resistance zone between the USD 9,800 to USD 9,840. It, however, would decline below USD 9,300, if BTC fails to break the hurdle of the USD 9,400 and USD 9,500. A continuous bearish trend risks leading BTC price to be fallen by USD 9,080. And, later, the price can be lowered towards the USD 9,000," said Aayush Jindal, an analyst of NewsBTC.
"If BTC price breaks the USD 9,600 resistance zone with Bitcoin bulls, a rally towards up to USD 10,376.38 should be expected. In an ascending triangle, BTC price is expected to record USD 11,986.46. On the other hand, when the price is dropped by USD 9,078.86 to USD 8,910.04, the bullish trend would be turn into the bearish trend, prompting BTC price to be fallen by USD 8,638.79 to USD 8,130.58," analyzed Cointelegraph, a digital currency media.
<저작권자 ⓒ 코인리더스 무단전재 및 재배포 금지>
|


많이 본 기사
English 많이 본 기사
|